
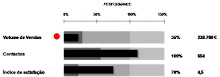
Bullet graph - The ultimate graph? I´m not sure about that...
The Bullet graph created by Stephen Few has some disadvantages...
- Doesn´t show the past. In order to work well, we always need a sparkline graph to show evolution.
- It´s not very different from a gauge. The bullet is a sort of a "long" gauge.
- Doesnt´t work well if your kpi can drop to negative numbers.

- Doesn´t make any sense if you use it alone!
- Unlike a gauge, most people don't understand it immediately.
- Sometimes, when we use a Bullet, it's a case where design tries to overshadow information.
- Doesn't make any sense if you compare different types of kpi. It only makes sense if we are analyzing performances and comparing results with targets.

The ultimate graph? For me? Sparklines! With other information signs, it can be very effective.
Author: Jorge Caldeira


Sem comentários:
Enviar um comentário